Buy Low, Sell High? Paths to Profit in Treacherous Markets
The Savvy Investor’s 10-Minute Guide to the Basics of Market Timing & Technical Analysis

Click this link for access to a free Family Wealth Education Institute class on advanced estate planning and estate tax control/elimination personally taught by Dr. Camarda & “Super Board-Certified Tax Lawyer” John Crawford. 

What This Report Will Teach You

  • Understanding the basics of identifying and predicting market trends 
  • Using “top down” trend information to plan profit strategies for any market
  • How to spot where “big money” is going – and move quicker than it does
  • Combining fundamental and technical factors to refine investment picks to exploit trends
  • Simple ways to profit from up, down, and sideways markets
  • Basics of chart reading and how to apply them
  • How to transfer technical skills to currency and commodities markets
  • And much, much more!

Bean Counters vs. Witch Doctors

There are two basic schools of stock market analysis, fundamental analysis, and technical analysis. Fundamental analysis looks at numbers and “hard data” – earnings and debt load, growth rates, currency rates and competitive environments, and so on, while technical analysis studies charts and historical price patterns as a proxy for human market behavior, and attempts to predict future behavior based on the interpretation of past patterns. 

While both are considered valid approaches, technical analysis tends to endure much ribbing, even disparaged as a “voodoo” practice, especially by folks steeped in fundamental analysis, as I was. In fact, I can remember no instance of technical learning in my CFA®, CFP®, or other of my professional designation curricula. 

I find this quite a shame.  In the post-2008 markets meltdown era, I began a passionate study of technical analysis, as I sought for “better ways” to manage our clients’ portfolios in what was clearly a time of new market rhythms. The power of what I have learned has astonished me, even of some of my CFA® peers still dismiss it as “tea leaf hokum.” If deftly practiced (a big if, I agree), it works. Moreover, the basic tenants – the fundamentals, the everyday tools – are fairly simple to learn and use, and I hope this report gives you some insight into this powerful system, whether you choose to learn to practice yourself, or use your new knowledge to better select an advisor to help you.

While the tools of technical analysis are timeless, the internet age has made once-tedious work a snap. These days, everyone uses software, and there must be hundreds if not thousands of software packages and internet sites intended to help with this. Feel free to make your own choice; most of this report’s discussion is not software-specific, and it should not matter what you use.  Where I need to make examples for charts, I will use TD Ameritrade’s Investools™ package as the source.  While I have not been paid (or even asked) to do this, in my opinion it is one of the best tools out there, and supported (for a stiff price!) by an educational suite which is just staggering. 

Top down approach – the trend is your friend! 

The cardinal rule of technical analysis is to invest congruently with the direction of identified trends. Investing with the trend is like swimming downstream, easy, predictable, and relatively safe. Bucking the trend is said by chartists to be like going against the current, hard, exhausting, and perilous. Trends can be said to exist for all investments, from broad market indexes to individual stocks (which may or may not be moving with the major trends.) Investments whose trends match overall market trends are thought to be easier to predict and profit from.
Using a “top down” approach simply means first looking at the big indexes, like the DOW, S&P 500, and NASDAQ (the “top”), then looking at market segments, and finally at individual stocks. You want to first establish what you think the major market trend is; that is what we mean by “top” down. Trends can be up, down, or sideways.
Since things never go straight up or straight down, an up trending is described as a series of “higher highs and higher lows,”, a downtrend as lower highs and lower lows, and a sideways or “trading range” trend as a pattern of level highs and lows that the stock seems to bounce between for an extended period.
Here’s some simple examples from recent memory, using the S&P 500 for the two years ending in early September, 2010. There are three trends here, can you spot them?

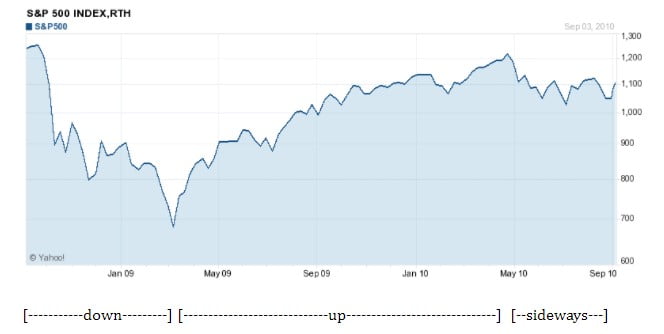
You will also notice that there are shorter term trends within the intermediate (lasting several months) trends I have indicated, and that nimble traders could have made money exploiting them.  For instance, here’s a closer look at the last six months of this graph, the part I’ve labeled as “sideways.”  As you can see, the short-term trends in the sideways intermediate market show some remarkable opportunities of their own:

Stacked Coins for Wealth Management Chart

Predicting the Trend 

After a little practice reading charts, spotting trends is quite easy, as you can see from our little example.  Reading history is a no-brainer once you get the hang of it. Much tougher is predicting the future…but such prediction is the basis on which profits from technical analysis depend. 

For those beginning technical analysis, it is probably best to try and identify short and intermediate term trends, and then try to extrapolate and trade on them.  I cannot overemphasize the importance of two critical rules:

  1. Your trade strategy must match the timeframe of the trend you are predicting. The intermediate sideways trend of May-Sept 2010 would dictate one strategy, and the short term up trend of July and following short term down trend of August quite another. Timing is everything. 
  2. The markets – and their trends – can change with blinding speed.  Once you decide to make a trade based on your opinion of a trend, you must be extremely attentive to changes, and be prepared to act when this happens.  You must have a “Plan B” to exit your trade in case you are wrong, and to get out with a decent result whenever things change, even when you are right.  You must be constantly watching, and know what you are going to do before it hits the fan. If you wait to formulate strategy on the fly, you may be doomed.

Leverage the Trend

The next basic concept is learning how to make the trend you have identified really work for you. Some things go up far more in an uptrend than the underlying market in general, and such investments can really magnify your gains.  In a down trend, some dogs go down far more that the indexes would indicate, and gains can be bigger if you bet against these than against the market in general. 

This concept is generally referred to as beta (β), where a higher number for β suggests a stock will go up more in good markets and down more in bad ones than the market  in general. 

A good way to work this is to study how particular industries or sectors are currently performing verses “the market.” I stress the “currently” because, as we have just said, things can change with blinding speed.  You have to be vigilant to spot these shifting anomalies. 

For instance, here is a 26-week sector graph of the best and worst performing sector groups, for simplicity. Sectors include many industries, so a graph by industry would include many more data bars – and many more opportunities.  But the sector graph makes the point pretty clearly. The overall market trend during this period would have been generally sideways.  But those attentive investors who had been aware that technology was “on a roll” would have handsomely profited, had they made the right moves. 

In most markets, some things are usually doing far better than others. Your task as a trader is to spot and exploit these discrepancies. One of the big reasons for these stems from the activities of large institutional investors like mutual funds and pensions as they collectively deploy their huge asset bases.  While investors of this sort are widely perceived as poor forecasters when it comes to profitably employing their clients’ money, it cannot be argued that their gargantuan capital flows move the markets, at least in the short and intermediate terms. Since they must, with billions of dollars to marshal, move much, much slower than smaller, nimbler investors like us or you, spotting the trends they are making, in time to capitalize on them, is very possible, and “riding their coattails” (to use a Warren Buffett expression) can be enormously profitable. Here is one way to attempt this. 

Charts like the following show relative performance, as in which industries or sectors are doing relatively better than the market, and which worse. In the end, stocks (and other markets) go up because more “people” are buying then selling, and go down because sellers outnumber buyers.  With their huge capital flows, big-money investors can’t help but move the markets – up or down – as they modify their investment strategies. Tracking relative performance can be a good proxy for what the “big money” is doing, and riding such a trend can really pay off.  Bucking it can make for a rough road.

This chart shows the relative performance of several industries in the basic materials sector, over time, so you can see trend shifts. In this example, the chemical manufacturing industry went from being in the bottom 16% on 7-2-10, to in the top 7% by 9-17-10.  Many technical traders would feel it flashed a buy signal in early August (you read this chart right to left), as it went from red to yellow, to green, as the relative performance (the number in the colored square) kept improving.

Adding a Bean or Two to the Witch’s Brew

So far, we have focused entirely on technical analysis – price patterns that stocks and markets make, regardless of the “quality” of the underlying assets. But quality can matter, and sprinkling a quantitative measure of it – fundamental analysis – over the crystal ball can improve results.  How?  Higher quality companies should outperform, if you are long = bullish = expecting higher prices.  Lower quality companies should do worse, useful if you are short = bearish = expecting lower prices.

Let’s talk about some of the more common tools in the beancounter’s bag, which you may want to consider. 

The first is the venerable price to earnings ratio, which tells us how cheap or dear a stock is relative to its earnings capacity. Lower P/E’s are thought to be better, since they signal better values, but a too-low P/E can be a warning flag. The P/E relative ratio tells us where the stocks present P/E stands in relation to its historical range; lower numbers mean the stock is trading relatively cheaply based on where it has been and where it might go again.  The Earnings Per Share (EPS) Growth rate is another indicator of value – the faster earnings are growing, the more valuable the stock should become. So is Cash Flow Growth – cash flow is business’ life’s blood, and increases here translate into higher value. Finally, the debt/equity ratio is worth a look, since it measures how much the company owes vs. the total value of stock outstanding; the lower the better, since the less of the company is in hock, the more value there ought to be for shareholders. A ratio of .2 would mean a company only had 1/5 as much debt as the value of its stock – a manageable debt load in most instances.  

While a deep discussion of valuation techniques is far beyond the scope of this report, it is important to note that the best technical traders are aware of fundamental factors, and frequently use them to enlighten their investment decisions.  This is just another way to “leverage” the trend, by finding situations that should go up more in up trends, and down more in down trends.

Simple Ways to Profit from Up, Down, and Sideways Markets

The first important point to make is that the market does not have to move up for you to make money.  There is much profit to be had in any sort of market, if you know how to call and play it.

The simplest way is to buy higher β stocks during up trends, and short higher β stocks in down trends.  In sideways trends, simply buy near the bottom of the cycle and sell near the top; more conservative traders will simply wait for the stock to head back down before buying again, and the more intrepid might short at the top of the trading range.

It is important to note that shorting stock means selling stock you do not own:  you borrow from a broker and sell a stock you think is headed down at a higher price, expecting to be able to buy (“cover”) later at a lower price, thus returning the stock  you borrowed to sell.  This can be quite risky, since if you are wrong the stock could theoretically go up infinitely high, leaving you to chase it to the moon to buy to replace the stock you borrowed (yes, they make you do that!)  So called “inverse ETF’s” can give you short exposure without the “chase the moon” risk, but unfortunately are not nearly as profitable for a given down move as a genuine short.

Options are another way to exploit trends, and offer the opportunity of leverage – the ability to earn (or lose!) a greater percentage profit on a stock than the stock itself moves. There are many ways to use options, far more than we have words for here. The simplest are directional plays, like buying a call option on a stock you think will go up, or a put on a bearish expectation. Many people who do this lose, since even when they are right the options can expire before the stock makes the expected move.  Safer is selling calls (make sure you own the stock, so you are covered!  Selling naked calls is very risky…) on stocks you expect to move sideways, or not up as much as where you sell the call. Probably my favorite (and one of the safest strategies) is the so-called “short vertical spread.” Despite the weird name, it really is a pretty simple play:  you sell one option (call or put) with a “strike” (exercise price) close to the price the stock is trading at, and buy one of the same sort with a strike farther from the stock’s price.  The “spread” is the difference in price between the strike prices.  Since you sell closer to the stock price (closer to “the money”) than you buy, you get paid more for the one you sell than you pay for the one you buy, which is why they call these “credit” spreads – you wind up with a net influx of cash…at least at the beginning. The reason these are lower risk is because your loss is sharply limited if you are wrong – that is why you buy the option farther from the money.  Here’s an example:  a stock is trading at $50, and you are bullish – you think it will go up.  You sell a put at a strike of $45, and get, say, $3 for it; you buy a protective put with a strike of $40, and we’ll say that costs $1. (The $45, $3, and $1 are per share prices; you will be dealing in real money in intervals of 100x these).  So you pay $1, get $3, and net $2.  If you are right and the stock goes up, the puts expire worthless, and you get to keep the $2.  This is the goal.  If the stock goes down, your loss is capped at the $5 loss on the stock (the $45 put you sold makes you buy at $45, but the $40 put you bought lets you sell at $40), minus the $1 you paid for the protective put, plus the $3 you got for selling the $45 put; this adds up to a maximum loss of $3. If you were attentive and got out before the trade went to heck, you could have controlled your loss at far less than $3. Anyway, those are the basics of how short verticals work.  You use calls if you are bearish (down trend), puts as described if bullish, and can use either in a sideways market, or even take both sides, which is called an Iron Condor. 

By the way, do not mistake the “simple” in this section title for “easy;” developing skill in technical trading requires a massive commitment to learning and discipline, even if  you have the aptitude. It is very easy to lose your shirt trying to time the market, and many have, and many more will.  Most market timers and options players lose money. This is not meant to discourage you, but rather to make sure you appreciate that developing such a skill – which you would use to compete with legions of other sharp, professional, and profits-hungry investors, all fighting to make sure it’s your money and not theirs that gets lost – requires a strong commitment to learning and studying markets on a continuous full-time basis.  Like a sport, you must constantly train, or you will lose your edge and get burnt.  But for those with the time and aptitude (or those who choose to seek out skilled professionals to do it for them), the rewards can be very satisfying! 

Laptop Work with Stacked Coins

Basics of Chart Reading and How to Apply Them

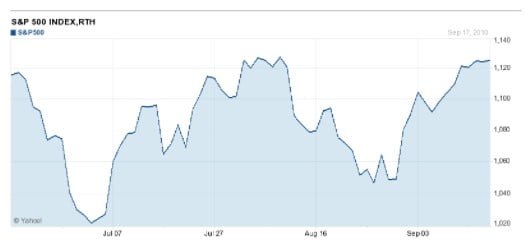
The tea leaves can get very involved, believe me! Let’s start with the basic chart we looked at in the beginning, the one I called an intermediate term sideways trend:

This one really just shows us the closing prices for the S&P 500 during the late summer of 2010. We can see that things bounced up and down, and ended the period at pretty much the same level as it began.  You might infer a resistance level (a price level a stock has a hard time moving above, which could represent an upper trading bound), and support levels (lower bounds prices tend to bounce up off of)  around 1120, and support levels at 1020, 1050, and 1070.

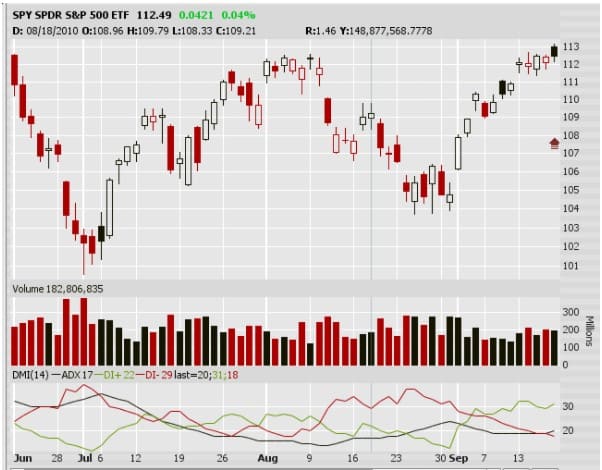
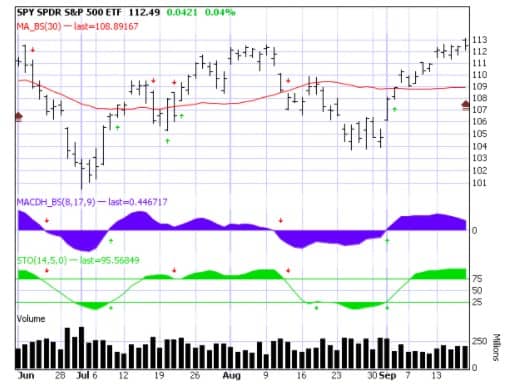
This next graph gives a lot more information.  The vertical lines show the price range for each day, and the horizontal lines sticking out from then show where the price opened the trading day (left line) and where it closed (right line). The red line shows the moving average – what the average closing price for the last x days (30 days in this case) has been.  The “moving” just means we use the last 30 days – the 30 day period “moves” forward one trading day at a time. This is a very important line since it lets us know at a glance if the stock is currently trading above or below the average of recent history. Breaking through the moving average on the upside (the moving average is sometimes considered as a type of resistance level) is considered bullish, and on the downside (where it might be considered a support level) is bearish.  The blue and green sections are more advanced technical indicators, and we will not discuss them here. The black vertical bars at the bottom represent volume, and these are both basic and important. Price moves – up or down – on light volume are not considered significant, at least by themselves.  Strong volume, however, signals that major market participants are buying or selling heavily, and lend credence to your opinion of up or down trends.

This last graph is more sophisticated still. It is in the so-called candlestick style, a method developed by 19th Century Japanese rice traders as a way to visually and efficiently capture a lot of trading information. Without getting too much into the details, the color of the “candle” tells us if the day was up (white here) or down (red or black; red in this case is “worse” since it indicates both a down day and a close lower than previously). In addition to all the quick visual information – it takes lots of training and practice, but once mastered (and maintained!) you can see an awful lot with just  a quick look – the patterns of the candles themselves and the cluster patterns they form can be remarkably illuminating to the adept. While there are likely thousands of patterns, with many including three or more candles, here are a few of the most basic:

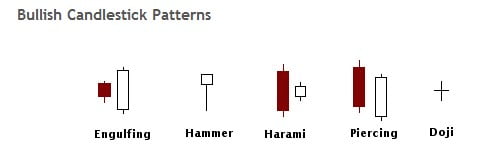
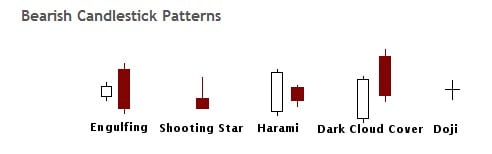
Again, these are very basic patterns, and there are many variations of each.

In the chart below, major turning points – the bounces to the upside – we were indicated by hammers, see if you can find them.  Turns down were indicated by “the hanging man,” another basic pattern which is the same as the hammer, but occurs at resistance, instead of support as for the hammer. Take a moment to study the chart, and then look at some “answers” below it.

Here is the hammer (center candle) that signaled the beginning of the uptrend around July 5th.

The third candle is the hanging man, about July 18th, presaging the big drop the next day; the last candle is a hammer, just before the market turned and ran up strongly until mid-August.

Hanging man again, center candle, about August 9th; the market turned down two days later.

This hammer showed up around August 29th, right before the big run up through mid-September.

And, as an especially tantalizing taste of the joys to come with study, here is a Morningstar pattern – it includes all three candles shown – which occurred right after the previous hammer, confirming the signal, and beginning the big breakout move up though the end of the chart.

Try to find these patterns on the chart – you have the dates so it will be very quick – and think about the context in which they appeared. Remember, a trader is making decisions before the chart “happens.” A good way to practice is to hold a card over the chart, and slowly move it to the right, first trying to predict what will happen next from the parts of the chart you have already revealed. Good luck!

Using technical skills in currency and commodities markets

This is a short section! Everything you have been introduced to in this report – save the short section on using fundamental indicators like P/E’s – can be applied to charting virtually any market, from currencies, to commodities (like gold or our friends the old Japanese rice traders), numismatic coins,  or the prices of muscle cars from the ‘60’s. Not that fundamentals are not important to these other markets, but they have difference things to measure. Remember, financial chartism is essentially a way to try and read collective market psychology, and predict what the market will be doing based on the prevailing net mood. That’s it, really.  Human brains – and the various mobs which are the markets – make money decisions pretty much the same way, whether they are buying a car, selling a house, or speculating on gold.  If you can learn to read the mind of the market – and that’s what technical analysis really is – it should work wherever you apply it.

Want to Be a Trader?  How to Learn More…

Here are two fundamental truths (and sorry for the beancounter pun):

  1. You CAN learn to become a very effective trader.  You can almost certainly do it, regardless of circumstance, education, or lack of genius intelligence, IF you have the will.
  2. You CAN NOT do it easily!  If you are to succeed, you must commit to – and follow through on – a significant amount of time dedicated to intense education.  This stuff is not hard per se (like my CFA® curriculum was hard…man, that was hard!), but it does require diligence, concentration, tons of memorization, and lots of practice. You must also resign yourself to an ongoing commitment to working the techniques and the market.  This is not a passive activity, rather it is like running a business.  You can to some extent pick the hours, but you must put in the hours or it all goes to the devil.  Finally, you must accept the fact that you will lose money.  Some of your trades will lose money – forever – that is part of the game.  In the beginning, you will lose on most trades, and you have to make peace with that going in or it will drive you nuts.  Or worse, it will drive you into a death spiral of increasingly bad decisions that could leave you broke.

So! As we said at the beginning, technical trading can be an enormously profitable practice, one well worth including in your investment strategy. There are several ways to go about this.  You can learn yourself (more on that in a bit), if you have the time and the passionate interest; many who start are thankful for the basic knowledge, but find they would rather pay a full time professional to do this for them, considering the small fee a small price to pay to avoid the hard work, time commitment, and enhanced risk of “practicing” with their own money. Basic knowledge is still very valuable, especially in being able to spot true professionals who actually know what they are talking about in this regard, from amongst the vast sea of those who may merely say they do. The second way, of course, is to simply find a good advisor who can do this for you, and hire them. A third way – and we are getting more and more clients this way lately – is to hire an advisor who specializes in technical trading, and watch what they do, along with doing some training on your own.  You may find this accelerates your learning curve, and may help you to avoid some of the inevitable (and expensive!) beginners’ mistakes. Once you have some knowledge and experience under your belt, you can decide if you want to strike out on  your own, or if you would rather pay a fee to have the freedom to enjoy your lifestyle instead of puzzling charts on a glowing monitor while your friends are hitting the back nine.

Here are some educational resources I think well of:

  1. The Investools program.  As mentioned, I think this is excellent, and offers education from beginning to advanced levels.  The two-year “PHD” program offers most of the Investools material, and costs about $25,000, plus travel and some other costs; after the two years is up, you have to pay more to stay in. Many folks don’t really complete it in two years, at least not to a deep level of understanding.  In fact the only real shortcoming of the program in my view is the lack of required, serious  testing. It is far too easy to take too casually, and so not have to work hard enough to master all of the wonderful material available. The time commitment is intense – classes in distant cites, daily reports, online training modules and testing, constant webinars and coaching sessions – but the hands-on, practical experience that can be gained by the devout is very useful.
  2. Chartered Market Technician® (CMT®) Professional Designation.  This is to technical analysis what the CFA® is to fundamental analysis, but not nearly as difficult from what I have heard from those who’ve done both. Unlike the Investools program, this one is more academically orientated, with lots more theoretical detail. The program is designed to take three years, but this can be accelerated by the motivated. 
  3. The book Technical Analysis of the Financial Markets: A Comprehensive Guide to Trading Methods and Applications (New York Institute of Finance) by John J. Murphy. A book like this is probably the best place to start, as the time and dollar commitments are far less than the first two.  The book – you can get it on Amazon – will give you enough to decide if you have a burning passion to learn more, and should consider a more intensive education program.  Good luck!

About the CFP®, ChFC®, and CFA®   Professional Designations

Of the author’s many professional designations, he feels these three to be the most important to the practice of wealth management, and well worth seeking in a financial advisor.  Here is a description of each.

CFP® Certified Financial Planner®: “A CFP® professional is an individual who has a demonstrated level of financial planning technical knowledge, experience in the field and holds to a client-centered code of ethics. CFP® practitioners develop theoretical and practical financial planning knowledge by completing a comprehensive course of study at a college or university offering a financial planning curriculum registered with the Certified Financial Planner Board of Standards. CFP® practitioners must pass a comprehensive two-day, 10-hour CFP® Certification Examination that tests their ability to apply their financial planning knowledge in an integrated format. Based on regularly updated research of what planners do, the CFP® Board’s exam covers the general principles of financial planning, insurance planning and risk management, employee benefits planning, investment planning, income tax planning, retirement planning and estate planning. CFP® practitioners must have a minimum of three years’ experience working in the financial planning process prior to earning the CFP® mark. As a result, CFP® practitioners have demonstrated a working knowledge of counseling skills in addition to their financial planning knowledge. CFP® practitioners must pass an ethics review and agree to abide by the CFP® Board’s Financial Planning Practice Standards and a strict code of professional conduct, known as the CFP® Board’s Code of Ethics and Professional Responsibility. The Code of Ethics states that CFP® practitioners are to act with integrity, offering professional services that are objective and based on client needs.” – FPA/Financial Planning Association

ChFC® Chartered Financial Consultant®:  “The Chartered Financial Consultant® (ChFC®) credential was introduced in 1982 as an alternative to the CFP® mark. This designation has the same core curriculum as the CFP® designation, plus two or three additional elective courses that focus on various areas of personal financial planning.  The biggest difference is that it does not require candidates to pass a comprehensive board exam, as with the CFP®. The CFP® designation requires less coursework but forces its students to learn the material in a way that allows them to proactively apply it in the board exam. The CLU® and ChFC® credentials require more coursework but have no comprehensive exam” – investopedia.com 

CFA®: Chartered Financial Analyst®: “The CFA® designation is regarded by most to be the key certification for investment professionals, especially in the areas of research and portfolio management. The CFA® designation is given to investment professionals who have successfully completed the requirements set by the globally recognized CFA® Institute (formerly the Association for Investment Management & Research, or AIMR). To be eligible for the CFA® designation, candidates must attain the following: 1) Have at least three years of professional investment experience; 2) Pass three rigorous six-hour exams over at least three years; 3) Commit to abiding by CFA® Institute’s Code of Ethics and Standards of Professional Conduct. The exams test the candidates’ knowledge of investment theory, ethics, financial accounting and portfolio management. This course of study was formed in 1962 and is constantly updated to ensure that the curriculum meets the demands of the global investment decision-making practice. This graduate-level curriculum generally entails six months of study prior to each exam date. Pass rates vary from year to year, but since the first exam was given in 1963, the overall rate is 59%; fewer than 20% of the candidates pass all three tests within three years. The CFA® Institute is a global non-profit professional organization of more than 58,000 financial analysts, portfolio managers and other financial professionals in 112 countries. In addition to administering the CFA® Program, the institute is also recognized around the world for its investment performance standards, code of ethics and standards of professional conduct. There are some very well-known investment professionals who hold the CFA® charter: Abby Joseph Cohen, Gary Brinson and Sir John Templeton. The reasons why these famous names pursued the CFA® designation may vary, but I believe it is safe to say they all have one thing in common: the desire to be the best.” – investopedia.com